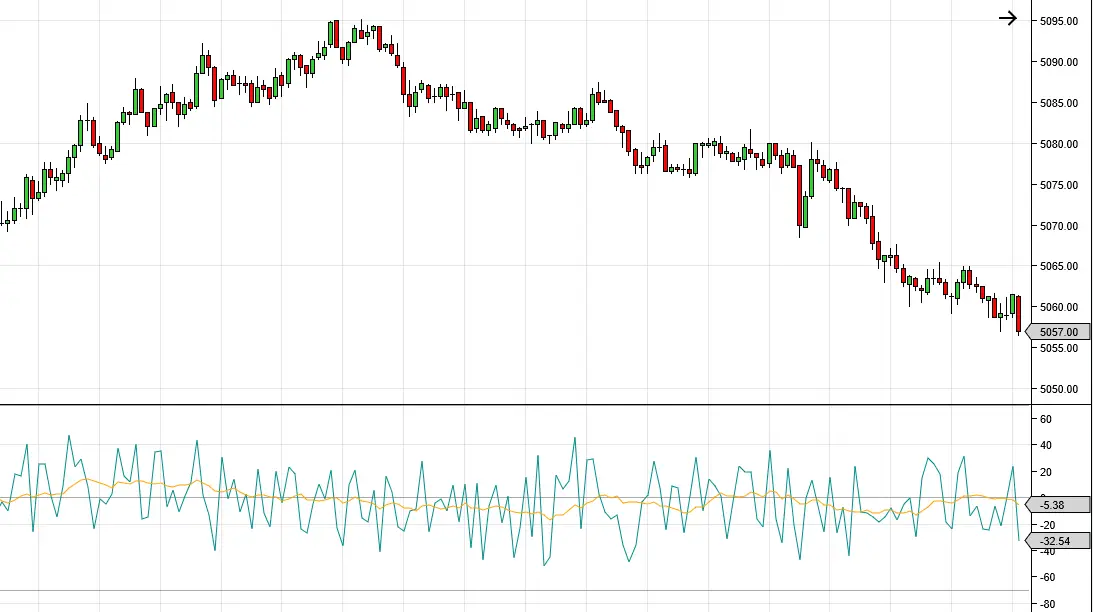
The Volume Buy/Sell Oscillator indicator for NinjaTrader 8 provides a unique view into how orders are being placed in real-time.
Trades are categorized in real-time as a buy (at the ask or above) or as a sell (at the bid or below) and categorized as such. The oscillator weighs the total amount of buy and sell orders to calculate the predominate consensus as a percentage value. 100 indicates that 100% of the orders were above the ask while -100 would indicate that 100% of the orders were at the bid or below. An adjustable moving average parameter allows for quick trend analysis.
For historical calculations, Tick Replay must be enabled. Otherwise this indicator will only update in real-time.

Market order behavior allows for insight into where entities are placing their orders. This indicator visually maps where these orders are taking place in real-time.
Comparing the amount of orders being placed at or above the asking price of the underlying instrument or at the bid or below you can begin seeing a consensus.
The Y-axis maps the order comparison between buy and sells +100 to -100 signifying 100% of the orders are buys (+100) to 100% of the orders are sells (-100.) A comparison of the buy and sells relation is displayed as an integer between those values.
A customizable period simple moving average is also prominently displayed which more clearly defines trending behavior.
The volume buy/sell indicator for NinjaTrader can provide insight into the strength of price behavior. Comparisons between price movement and the value of the oscillator provide confirmation or rejection to directional strength.
For example, if there is a large number of buy orders in relation to sell but within that bar or period price did not move much to the upside or even went down might signify high downward pressure.
Because the moving average of the oscillator values typically follows price, it is a prime identifier for outliers which can be acted upon.
Disclaimer
Copyright 2024 @ Lucrum Trading Systems. All rights reserved. Privacy Policy