The Divergence Indicator for NinjaTrader 7 and 8 utilizes a sophisticated algorithm to detect divergence, and eliminates some shortcomings of typical divergence indicators. It can be calculated using ANY indicator that you have in NinjaTrader (ex. RSI, MACD, Stochastic, or any custom indicators). Additionally, the Divergence Indicator contains a powerful Analysis Window that allows you to find which types of divergence are the most profitable.


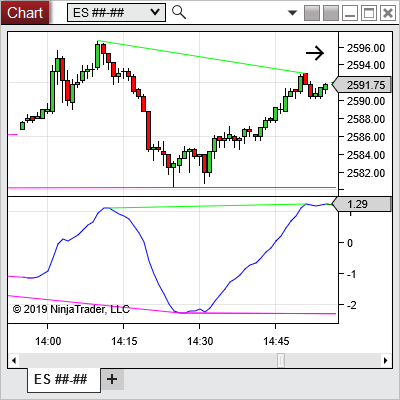
The simple definition of divergence is when price is moving in the opposite direction of a given indicator. Typically divergence is calculated using an oscillator type of indicator. Some common indicators used to detect divergence include the MACD, RSI, and Stochastic indicators. The image below shows an example of divergence using the MACD indicator, which is the blue line at the bottom of the chart. The indicator has drawn lines on the price chart connecting lower highs in price. Similarly, the indicator has drawn a line on the MACD chart connecting higher highs. Since price is making lower highs, and the indicator is making higher highs, we have divergence!

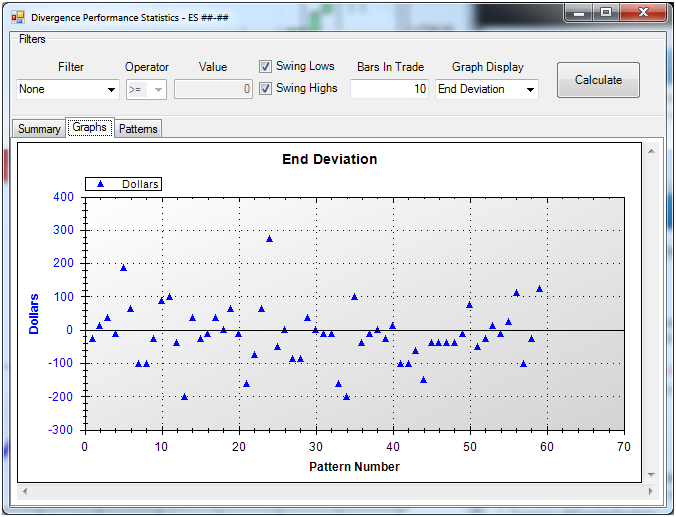
The Analysis Window of the Divergence Indicator will tell you where the market typically moves after the divergences are detected. Unlike a typical strategy performance report, the Analysis window shows you how far the market moved in either direction as opposed to how much money was made or lost on the trade. The user is allowed to pick the maximum number of bars after the divergence pattern to analyze (the Bars In Trade parameter in the image above). The Analysis Window will then calculate the minimum, maximum, and ending deviation from the entry price. In other words, it will tell you the maximum profit and loss that the trade could have achieved. Green numbers in the Analysis Window indicate that the market moved up the specified amount, while red numbers indicate the market moved down the specified amount. These numbers are very useful in determining where to place stop loss and profit target orders on your trades.
The Analysis Window also contains a page to view graphs as well as a detailed list of divergences found by the indicator. This list can easily be copy and pasted in to Excel to perform further analysis.
Disclaimer
Copyright 2024 @ Lucrum Trading Systems. All rights reserved. Privacy Policy